Yearly Financial Highlights
FINANCIAL STATEMENTS FOR THE FULL YEAR ENDED 31 DECEMBER 2025
Financials Archive![]() Note: Files are in Adobe (PDF) format.
Note: Files are in Adobe (PDF) format.
Please download the free Adobe Acrobat Reader to view these documents.
Balance Sheet
| Group 31/12/25 S$'000 |
Group 31/12/24 S$'000 |
||
| Current assets | |||
| Trade and other receivables | 5,418 | 8,632 | |
| Financial derivatives | 3,790 | 32,724 | |
| Cash and cash equivalents | 47,771 | 29,471 | |
| 56,979 | 70,827 | ||
| Non-current assets | |||
| Investment properties | 2,573,340 | 2,464,764 | |
| Interests in subsidiaries | - | - | |
| Trade and other receivables | - | - | |
| Financial derivatives | 22,659 | 15,556 | |
| 2,595,999 | 2,480,320 | ||
| Total assets | 2,652,978 | 2,551,147 | |
| Current liabilities | |||
| Financial derivatives | 8,333 | - | |
| Trade and other payables | 33,473 | 40,356 | |
| Current portion of security deposits | 390 | 472 | |
| Lease liabilities | 14 | 15 | |
| Loans and borrowings | 166,665 | 17,797 | |
| 208,875 | 58,640 | ||
| Non-current liabilities | |||
| Financial derivatives | 3,444 | 677 | |
| Non-current portion of security deposits | 14,477 | 16,058 | |
| Lease liabilities | 2,040 | 2,054 | |
| Loans and borrowings | 716,783 | 866,243 | |
| Deferred income | 1,050 | 1,279 | |
| Deferred tax liabilities | 35,952 | 36,244 | |
| 773,746 | 922,555 | ||
| Total liabilities | 982,621 | 981,195 | |
| Net assets | 1,670,357 | 1,569,952 | |
| Represented by: | |||
| Unitholders' funds | 1,670,357 | 1,569,952 | |
| Units in issue and to be issued at the end of the year (‘000) | 652,653 | 652,371 | |
| Net asset value per unit ($) | 2.56 | 2.41 |
Review of Performance
Summary of Parkway Life REIT's Results for the full year ended 31 December 2025
| Note |
2025
S$'000 |
2024
S$'000 |
Change
S$'000 |
Change
% |
|
| Gross Revenue | 156,294 | 145,268 | 11,026 | 7.6 | |
| Net Property Income |
147,484 | 136,597 | 10,887 | 8.0 | |
| Distributable Income to Unitholders | (a) | 99,781 | 91,419 | 8,362 | 9.1 |
| Distribution per unit based on Distributable Income to Unitholders (cents) | (b) | 15.29 | 14.92 | 0.37 | 2.5 |
| Distribution yield (%), based on - Closing market price of $4.08 as at 31 December 2025 |
3.75 | 3.66 | 2.5 |
Note:
- Net of amount retained for capital expenditure on existing properties amounting to $3.0 million each year
- In computing the Distribution per Unit ("DPU"), the number of units in issue as at the end of each period is used.
Consolidated Statements of Total Return
2H 2025 Vs 2H 2024
Gross revenue for 2H 2025 had increased by 7.1% year-on-year to $78.0 million. The increase was due to contribution from one nursing home acquired in August 2024 and eleven nursing homes acquired in December 2024. This was partially offset by the depreciation of Japanese Yen, reduced rental income due to a tenant default affecting two Japan nursing home properties and lower rent following the divestment of the Malaysia portfolio completed in August 2025. Correspondingly net property income had increased by 7.9% to $73.6 million for 2H 2025.
The management fees3 for 2H 2025 of $7.9 million was 7.2% higher than 2H 2024 largely attributed to the higher management fee from enlarged deposited property value from the acquisitions in 2024 and valuation gain on the Singapore portfolio. Higher trust expenses were registered for 2H 2025 due to higher professional fees incurred on existing assets and acquisition-related costs for the France portfolio. The acquisition-related costs have no distribution impact as they are not subject to deduction when computing distributable income to Unitholders.
Of the net foreign exchange movement, the Group had registered a realised foreign exchange gain amounting to about $3.4 million and $5.0 million from the settlement of Japanese Yen forward contracts in 2H 2025 and 2H 2024 respectively.
Finance costs had increased mainly due to funding of capital expenditure and new acquisitions in 2024 and higher interest costs from Japanese Yen debts partially offset by depreciation of JPY. Notwithstanding, interest cost on loans drawn down to fund capital expenditure has no distribution impact as they are not subject to deduction when computing distributable income to Unitholders. Interest income in 2025 mainly arose from the EUR/SGD cross currency swap arrangement and late payment interest from tenants as compared to fixed deposit placement in 2024.
Valuations were performed by independent professional valuers for all investment properties as at 31 December 2025. The valuation gain was largely contributed by the projected rent increase for the Singapore hospitals. Any fair value adjustments (surplus / deficit) in respect of the revaluation would not be taxable / deductible on the basis that the fair value changes are unrealised and the properties are held for long-term purposes.
The Group has step-up lease arrangements for certain of its properties which include 20.4-year master lease agreements for its three Singapore hospitals, the 20-year lease agreements for the three Japan nursing home properties and the 12-year lease agreements for the eleven France nursing home properties. As part of revenue recognition, the step-up lease arrangements were accounted on a straight-line basis over the lease term (i.e. effective rent). This had led to corresponding increase in the gross revenue and investment properties in the initial years of lease. As property valuation methodology deviates from effective rent accounting treatment, the Group had removed the impact of effective rent from investment properties accordingly. This resulted in adjustments in the net change in fair value of investment properties (See Note 3 to the Financial Statements). These properties with step-up lease arrangements contributed to the higher distributable income in 2H 2025 as compared to 2H 2024. As such, these fair value adjustments (surplus / deficit) would be adjusted out when determining the distributable income to the Unitholders.
Divestment of the Malaysia investment property was completed on 12 August 2025 and recorded a gain on disposal of $0.1 million.
Overall, DPU for 2H 2025 of 7.64 cents had outperformed by 3.5% or 0.26 cents as compared with 2H 2024's DPU of 7.38 cents.
2025 Vs 2024
Gross revenue for 2025 had increased by 7.6% year-on-year to $156.3 million. The increase was due to the contribution from one Japan nursing home acquired in August 2024, eleven France nursing homes acquired in December 2024, partially offset by the depreciation of the Japanese Yen, reduced rental income due to a tenant default affecting two Japan nursing home properties and lower rent following the divestment of the Malaysia portfolio. Correspondingly, the net property income had increased by 8.0% to $147.5 million for 2025.
The management fees for 2025 of $15.7 million was 8.2% higher than 2024 largely attributed to the higher net property income, the enlarged deposited property value from acquisitions in 2024 and valuation gain on the Singapore portfolio. Higher trust expenses were registered for 2025 due to higher professional fees incurred on existing assets and one-off professional fees incurred to restructure the holding structure of 4 assets of the France portfolio.
Of the net foreign exchange movement, the Group had registered a realised foreign exchange gain amounting to about $7.7 million and $9.7 million from the settlement of Japanese Yen and Euro forward contracts in 2025 and 2024 respectively.
Finance costs had increased mainly due to funding of capital expenditure and new acquisitions in 2024 and higher interest costs from Japanese Yen debts partially offset by depreciation of JPY. Notwithstanding, interest cost on loans drawn down to fund capital expenditure has no distribution impact as they are not subject to deduction when computing distributable income to Unitholders. Interest income mainly arose from the EUR/SGD cross currency swap arrangement and late payment interest from tenants in 2025 and fixed deposit placement in 2024.
At the reporting date, the Group had outstanding forward exchange contracts ("FEC") with aggregate notional amounts of approximately $115.0 million, comprising JPY FEC of $74.4 million, EUR FEC of $38.0 million and MYR FEC of $2.6 million. The change in fair value of $3.8 million loss was charged to the statement of total return.
The Group has recognised a net change in fair value of investment properties of $42.0 million gain in the Statement of Total Return, which includes net fair value gain of $64.7 million offset by impact from straight-line rental adjustments and amortisation of right-of-use assets amounting to $22.7 million.
Overall, DPU for 2025 of 15.29 cents has outperformed by 2.5% or 0.37 cents as compared with 2024's DPU of 14.92 cents.
Consolidated Statements of Financial Position
Lower trade and other receivables as of 31 December 2025 was mainly due to the receipt of rent receivables for the Japan properties. Included in the non-current trade and other receivables of the Trust are loans to subsidiaries in relation to the France acquisition.
The increase in investment properties was largely due to net valuation gain on the property portfolio. This was partially offset by the depreciation of the Japanese Yen and divestment of the Malaysia portfolio completed during the year. Excluding the impact from straight-line rental adjustments and amortisation of right-of-use assets amounting to $22.7 million, a fair value gain of $64.7 million was recognised in the Statement of Total Return, representing a gain of 2.6% in the total portfolio value. The valuation gain was largely contributed by the projected rent increase for the Singapore hospitals.
Lower trade and other payables were mainly due to settlement of Manager's performance fees for the financial year ended 31 December 2024, acquisition fees in relation to the France acquisition and capital expenditure for Mount Elizabeth Hospital ("MEH").
Apart from depreciation of the Japanese Yen, the overall decrease in total loans and borrowings was also attributed to a new 7-year committed and unsecured loan facility drawn down by the Group amounting to JPY6,250 million (approximately $51.5 million) to pre-emptively take out a maturing $81.8 million loan that had an accompanying SGD/JPY cross currency interest rate swap which matured in September 2025, partially offset by the net drawdown of $59.4 million for funding of capital expenditure and working capital purposes. With that, there is no long-term debt refinancing needs till October 2026.
Notwithstanding the net current liabilities position, based on the Group's existing financial resources, the Group believes that it will be able to refinance its borrowings and meet its current obligations as and when they fall due.
Consolidated Statement of Cash Flows
Net cash from operating activities in 2025 are mainly contributed by rental income from the properties net of property and other operating expenses.
Net cash outflow on purchase of investment properties (including acquisition-related costs) was as follows:
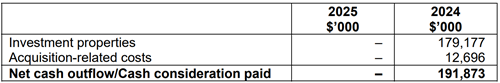
The acquisition-related costs paid in 2024 were in relation to the nursing home properties acquired in October 2023, August 2024 and December 2024.
Net cash used in investing activities as of 2025 mainly related to the payment of capital expenditure on existing properties and the capex expenditure for MEH. This was partially offset by the proceeds from divestment of the Malaysia Portfolio.
Net cash generated from financing activities in 2025 was mainly related to the net drawdown of borrowings, partially offset by payment of distributions to Unitholders.
Commentary
Parkway Life REIT's healthcare-focused portfolio across Singapore, Japan and France continues to demonstrate defensive characteristics supported by long-term lease contracts and structural demographic trends. The three Singapore hospitals operate under master leases extending to 2042 with an option to renew for a term of further term of 10 years till 2052, providing cash flow visibility that exceeds typical REIT lease profiles.
Across all markets, ageing populations and increasing longevity underpin sustained demand for healthcare services. The portfolio's defensive positioning is reinforced by several structural features. With 69.6% of rental income tied to CPI-based revisions, the Group provides natural inflation hedging. Geographic diversification across three developed markets with distinct regulatory frameworks and healthcare financing systems reduces concentration risk while allowing market-specific portfolio management approaches.
The Manager actively stewards the portfolio through asset enhancement and selective capital allocation. In Singapore, asset enhancement works at Mount Elizabeth Hospital have been largely completed, strengthening the quality of our flagship asset. In Japan, the Manager continues to evaluate capital recycling opportunities given the mature market characteristics and modest return environment. In France, where returns remain more favourable, the Manager assesses potential acquisition and asset enhancement opportunities that meet our quality and return criteria.
As of 31 December 2025, the Group has a capital structure which currently stands at close to 93% fixed-rate debt, 33.4% gearing ratio, and 8.6x interest coverage, providing financial flexibility as global interest rates remain elevated relative to the previous decade. This positioning enables disciplined capital deployment while ensuring balance sheet strength supports stable distributions to unitholders.
3 Comprising management fees payable to the Manager, i.e. base fee of 0.3% p.a. of the value of all the assets of PLife REIT and performance fee of 4.5% of the net property income of PLife REIT, as well as third party asset management fees.